What Is a Press Clipping?
Everything you need to know about clipping media coverage for PR reports.
A press clipping is a saved copy of a media mention. It can be an article in a newspaper, a blog post, a TV segment, a social media post, or a YouTube video. Back in the day, these used to be parts of articles that someone would literally cut out of a newspaper with a pair of scissors. PR teams have always collected press clippings to document earned media and include them in coverage reports, but nowadays clippings take the form of screenshots, and reports are obviously digital as well.
The concept of making a clip is simple. But when you have to create hundreds, things get complicated. This guide covers what press clippings are, how to create them for every type of media, what data to include alongside each clip, and how to turn a collection of clippings into a report that proves the value of your work.
What Is a Press Clipping?
As you read in the intro, the term “press clipping” dates back to a time when PR people literally cut articles out of newspapers and magazines with scissors. The clippings were then glued into binders as “proof of coverage”.
The concept has not changed. A press clipping is still a saved copy of a media mention. What has changed is the number of channels you need to monitor. Today, a single campaign can generate coverage across online publications, print magazines, social media platforms, podcasts, YouTube, and old-school TV. Each channel has to be clipped in a certain way.
An important point is that you will hear people refer to clippings in different ways: press clippings, media clippings, news clippings, or PR clippings. The common denominator here is the term clipping, and all of these mean the same thing.
Why Press Clippings Matter
Clippings are to PR coverage reports what oil is to fuel. It is the basic raw material. Without clips, there is no proof of coverage—and as you know, coverage is what drives the PR industry.
However, press clippings are more than receipts. They help you reach three objectives:
- Prove results. Clients and executives want to see where the brand appeared. A clip with a screenshot, publication name, and readership data is more convincing than a list of links in an email.
- Quantify reach. Each clipping should include metrics like estimated coverage views, publication readership, and social shares. These numbers quantify campaign reach.
- Build a media archive. Over time, your clippings become a searchable library of all earned media. This makes it easy to pull together monthly reports, annual summaries, or pitch decks.
How to Create Press Clippings
The clipping process depends on the type of media. Here is how to handle each one.
Online Articles
Online articles are the most common type of press clipping today. Here is what to capture:
Screenshot the article. Take a screenshot that shows the headline, publication logo, and the layout. Note that the clip is not meant to be a substitute for reading the article. You should include a link in your report so that readers can easily access it at the source.
To clip an online article on a Mac, press Shift + Command + 4. On Windows, press Windows + Shift + S. Both methods let you select exactly what part of the screen you want to capture.
Browser extensions can help when you need to capture an entire article that extends beyond the screen. Tools like Evernote Web Clipper or Pocket let you save full articles for later processing.
Save the metadata. For each online article, record:
- Publication name
- Article headline
- Publication date
- URL
Look up the metrics. The clip is not complete without data. For each article, you should find:
- Estimated monthly visitors of the publication (use SE Ranking or the publication’s own media kit)
- Estimated coverage views (a percentage of total site traffic, discounted based on article placement and visibility)
- Social share counts across platforms
Finding all of this data manually takes time. For a detailed breakdown of where to look, see our guide on where to find all data for your earned media report.
Social Media Posts
Social coverage includes posts about your client on Instagram, LinkedIn, X, TikTok, Facebook, and other platforms. Each platform handles metrics differently.
What to capture:
- Screenshot of the post as it appears on the platform
- Name and handle
- Post date
- Direct link to the post
Metrics to include:
- Likes, comments, shares, and reposts
- View count (when the platform provides it, such as on TikTok and X)
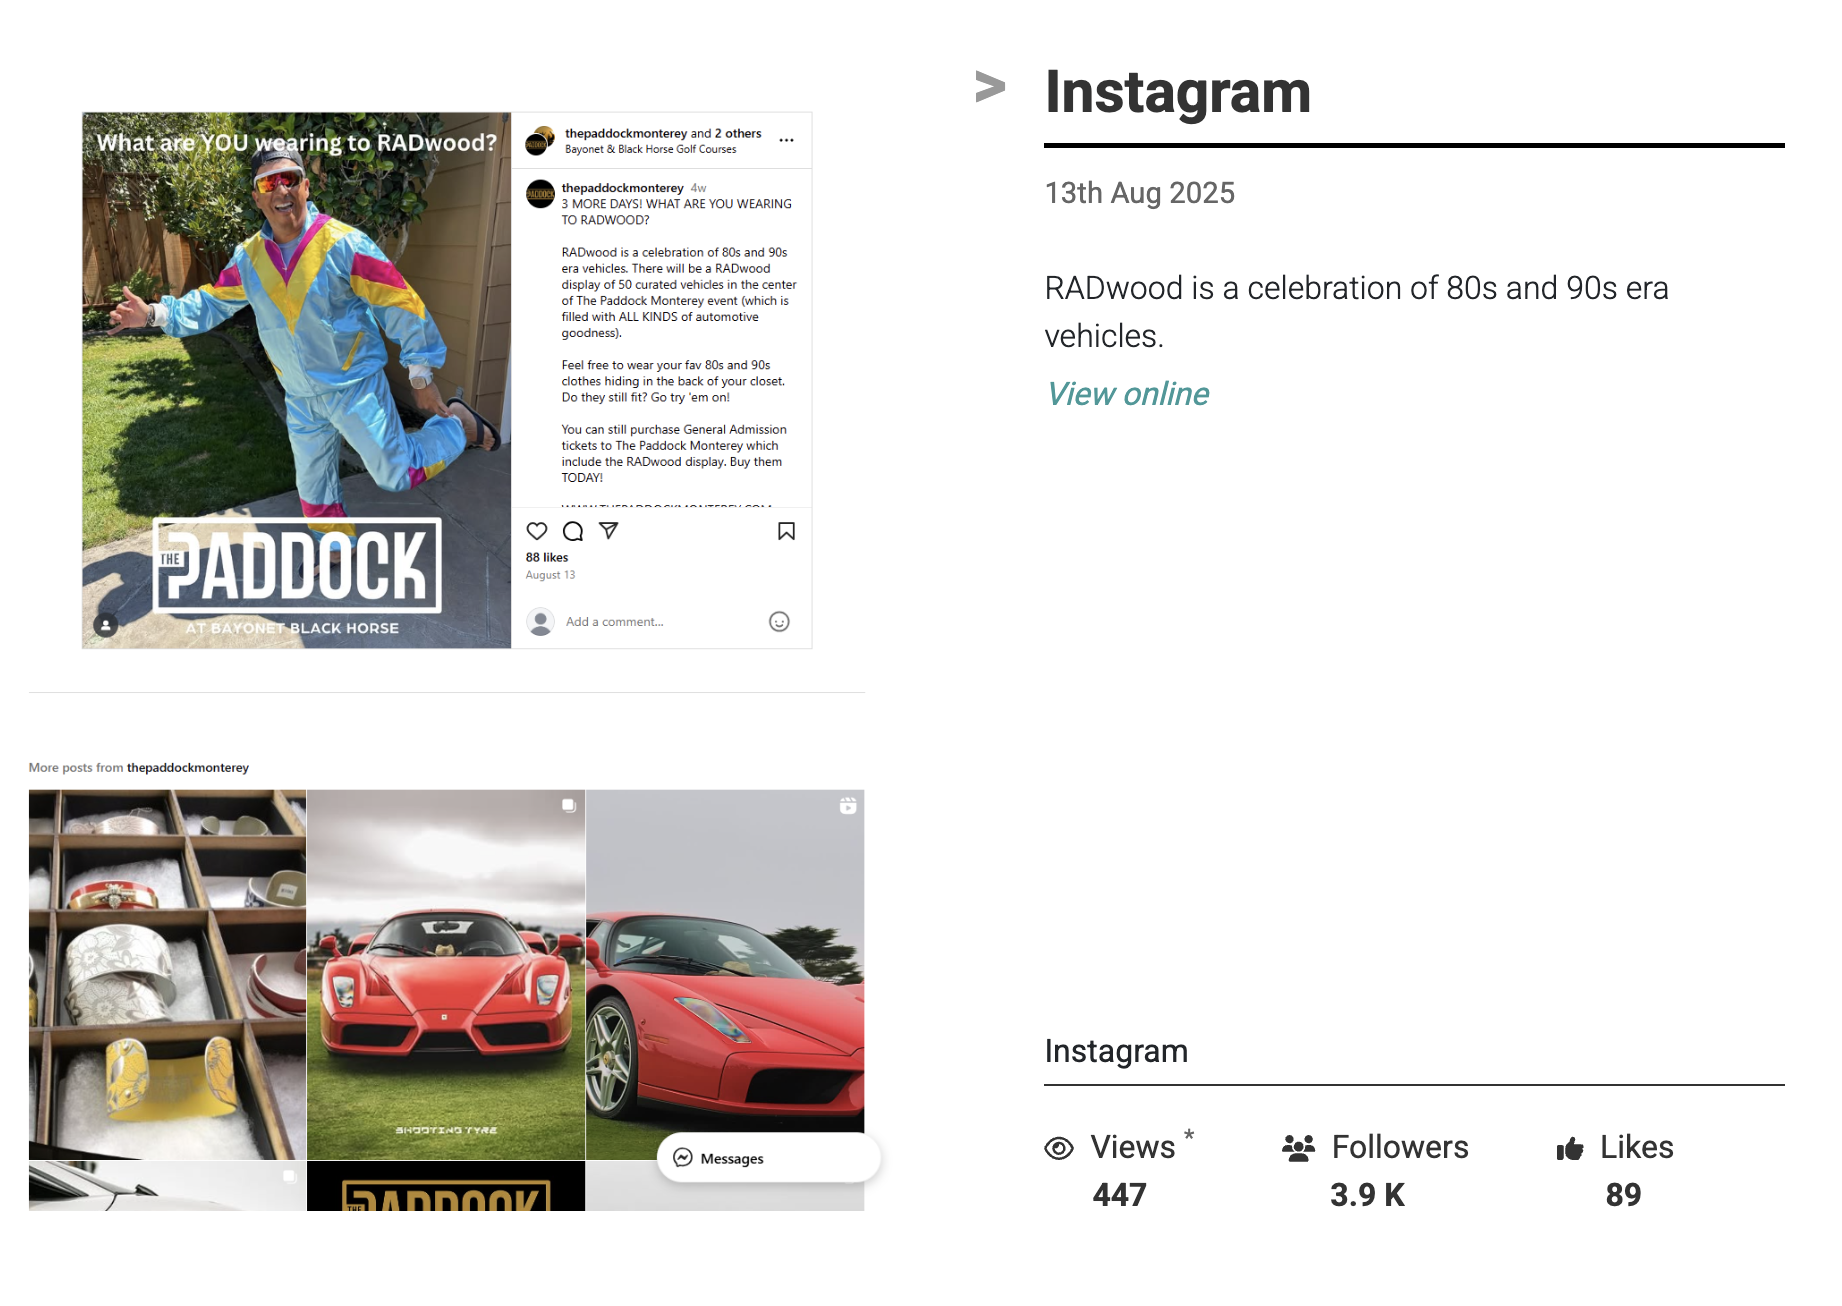
The challenge with social clippings is that metrics change. A post that has 50 likes today might have 50k if it goes viral next week. Decide on a consistent timing for when you capture social metrics and keep tabs on content that might go viral. Some teams clip after 48 hours, others at the end of the campaign period.
Print Media
Print clippings are the closest to the original meaning of press clipping. You are capturing an article from a physical newspaper or magazine.
How to clip print articles:
- Scan the page using a scanner or a phone with a scanning app. Most phones have a built-in document scanner, such as Preview on an iPhone.
- If you have access to a digital edition or PDF of the publication, take a screenshot from that.
- Make sure the scan is clean and readable. A blurry clip looks unprofessional in a report.
What to include:
- Publication name and edition date
- Page number
- Article headline and author
- Circulation data (check BPA for audited numbers or Wikipedia’s circulation lists)
Circulation is not the same as readership. Magazines are typically read by 2-3 people per copy (pass-along readership). Newspapers have a lower multiplier of 1.5-2x. Take this into account when reporting reach.
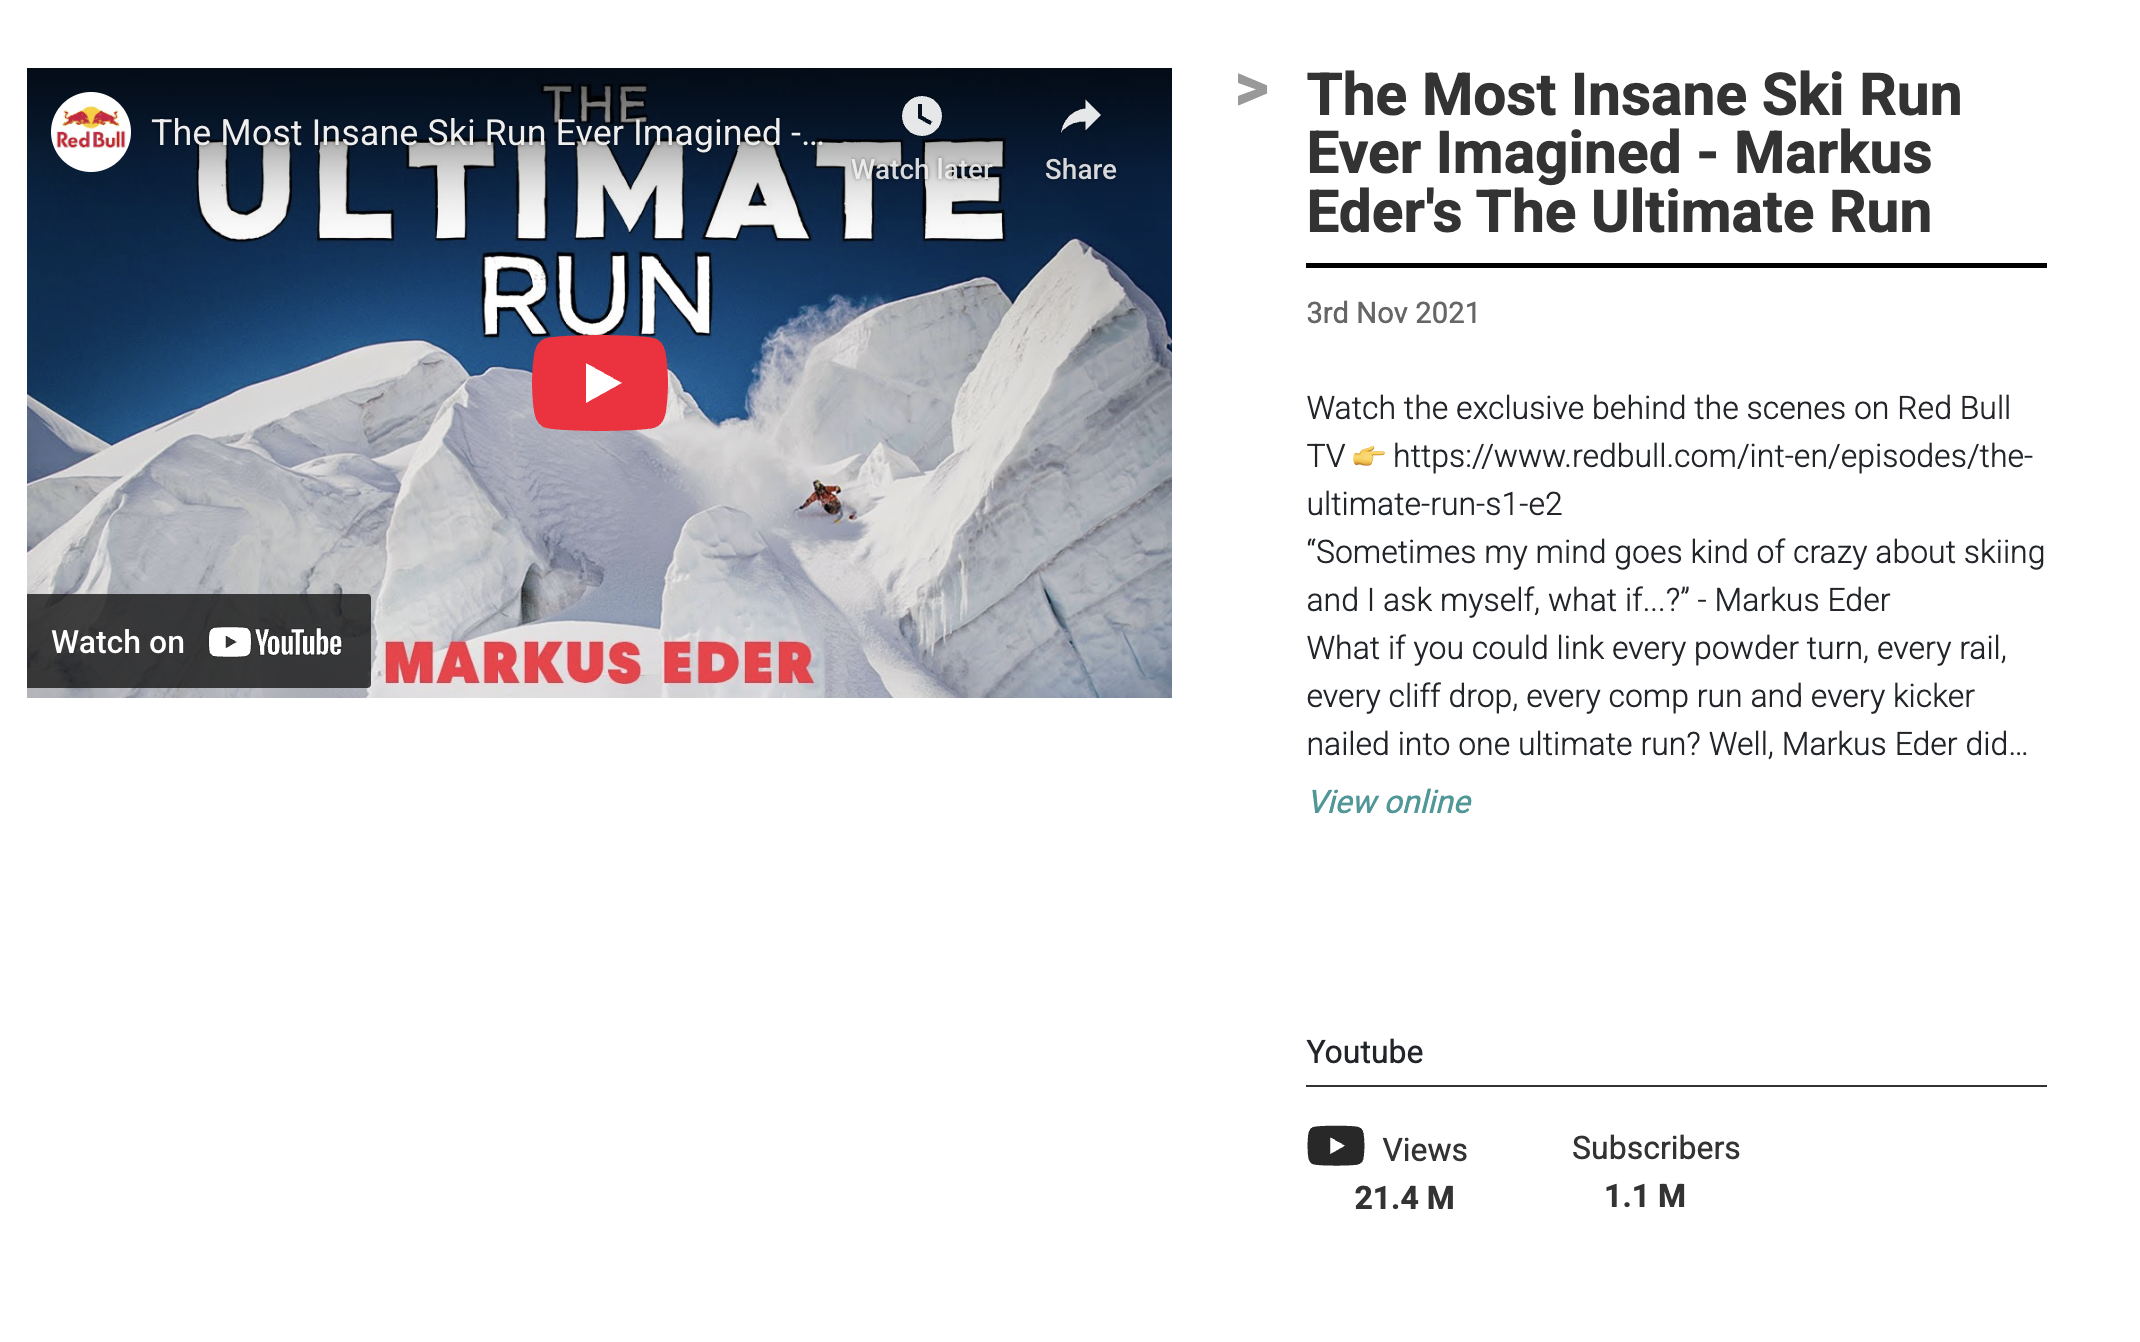
Video Coverage
Video coverage includes YouTube videos, TikTok posts, Instagram Reels, and broadcast TV segments. We have a detailed guide on how to clip YouTube videos for PR reports.
What to capture:
- Screenshot or thumbnail of the video
- Title and description
- Creator name and follower/subscriber count
- Direct link to the video
Metrics to include:
- View count (this is a verified number, unlike estimated views for articles)
- Likes and comments
- Duration of the video
Video metrics are some of the strongest numbers you can include in a coverage report, because they are real, not estimated. Track view counts at multiple points in time if possible, since videos often accumulate views for weeks after publication.
For broadcast TV and radio, use audience measurement data from organizations like Nielsen. Most countries have companies that publish viewer estimates.
What Data to Include With Every Clip
Regardless of the type of media, every press clipping in your report should include these elements:
| Element | Why it matters |
|---|---|
| Publication or platform name | Establishes credibility and context |
| Date | Shows when coverage appeared |
| Headline or post text | Summarizes what was said |
| Screenshot or visual | Makes the clip tangible and scannable |
| URL or link | Allows the reader to access the original |
| Readership or follower count | Shows the potential audience |
| Estimated coverage views | Shows how many people likely saw it |
| Social shares or engagement | Shows how far the coverage traveled |
From Clippings to a Clipping Report
Once you have collected all your press clippings, the next step is organizing them into a report. A clipping report is simply a PR coverage report built from your collected clips.
How to organize your clips
There are different ways to order press clippings in a report. Choose the one that tells the strongest story:
- By impact. Lead with your best placements. The coverage you are most proud of goes first, the second strongest goes last, and everything else sits in the middle. This is a technique borrowed from sales presentations.
- By channel. Group online articles, social posts, print clips, and video separately. This works well when you want to show breadth across media types.
- By date. Chronological order works for campaign reports where timing matters, such as product launches or events where you want to show how coverage built over time.
- By publication tier. Lead with tier-1 national media, followed by trade publications, then smaller outlets. This approach is effective when the client cares most about the prestige of placements.
Report structure
A clipping report follows this structure:
- Cover page with branding and campaign or period title.
- Executive summary with total clips, coverage views, social engagement, and key wins.
- Individual clip pages with screenshots, metrics, and publication data.
- Evaluation and next steps for campaigns that need ROI assessment.
For a full walkthrough of each section, including how to write the executive summary and calculate earned media value, see our complete guide on how to create a PR coverage report.
The Manual Clipping Workflow
Here is what creating press clippings manually looks like for a typical PR campaign with 20 placements:
- Find all coverage through your monitoring tools or Google Alerts.
- Visit each article and take a screenshot.
- Record the publication name, date, headline, and URL.
- Look up each publication’s traffic on SE Ranking.
- Estimate coverage views based on traffic and article placement.
- Check social share counts across Facebook, LinkedIn, X, and Pinterest.
- For video, record view counts and engagement.
- For print, scan the article and look up circulation data.
- Organize everything in PowerPoint, Google Slides, or Keynote.
- Format and align so it looks professional.
For 20 clips, this takes 3-4 hours. For 50 clips, you are looking at a full day.
Automate Your Press Clippings
ReachReport was built to eliminate the manual work of press clipping. Connect your monitoring tools (Google Alerts, Meltwater, Cision, Mention, Talkwalker) and receive all coverage in one place.
For each relevant mention, ReachReport:
- Creates a professional clip with a clean screenshot. The tool automatically reduces cookie banners, and other distractions.
- Enriches the clip with estimated article views, publication readership, and social engagement data.
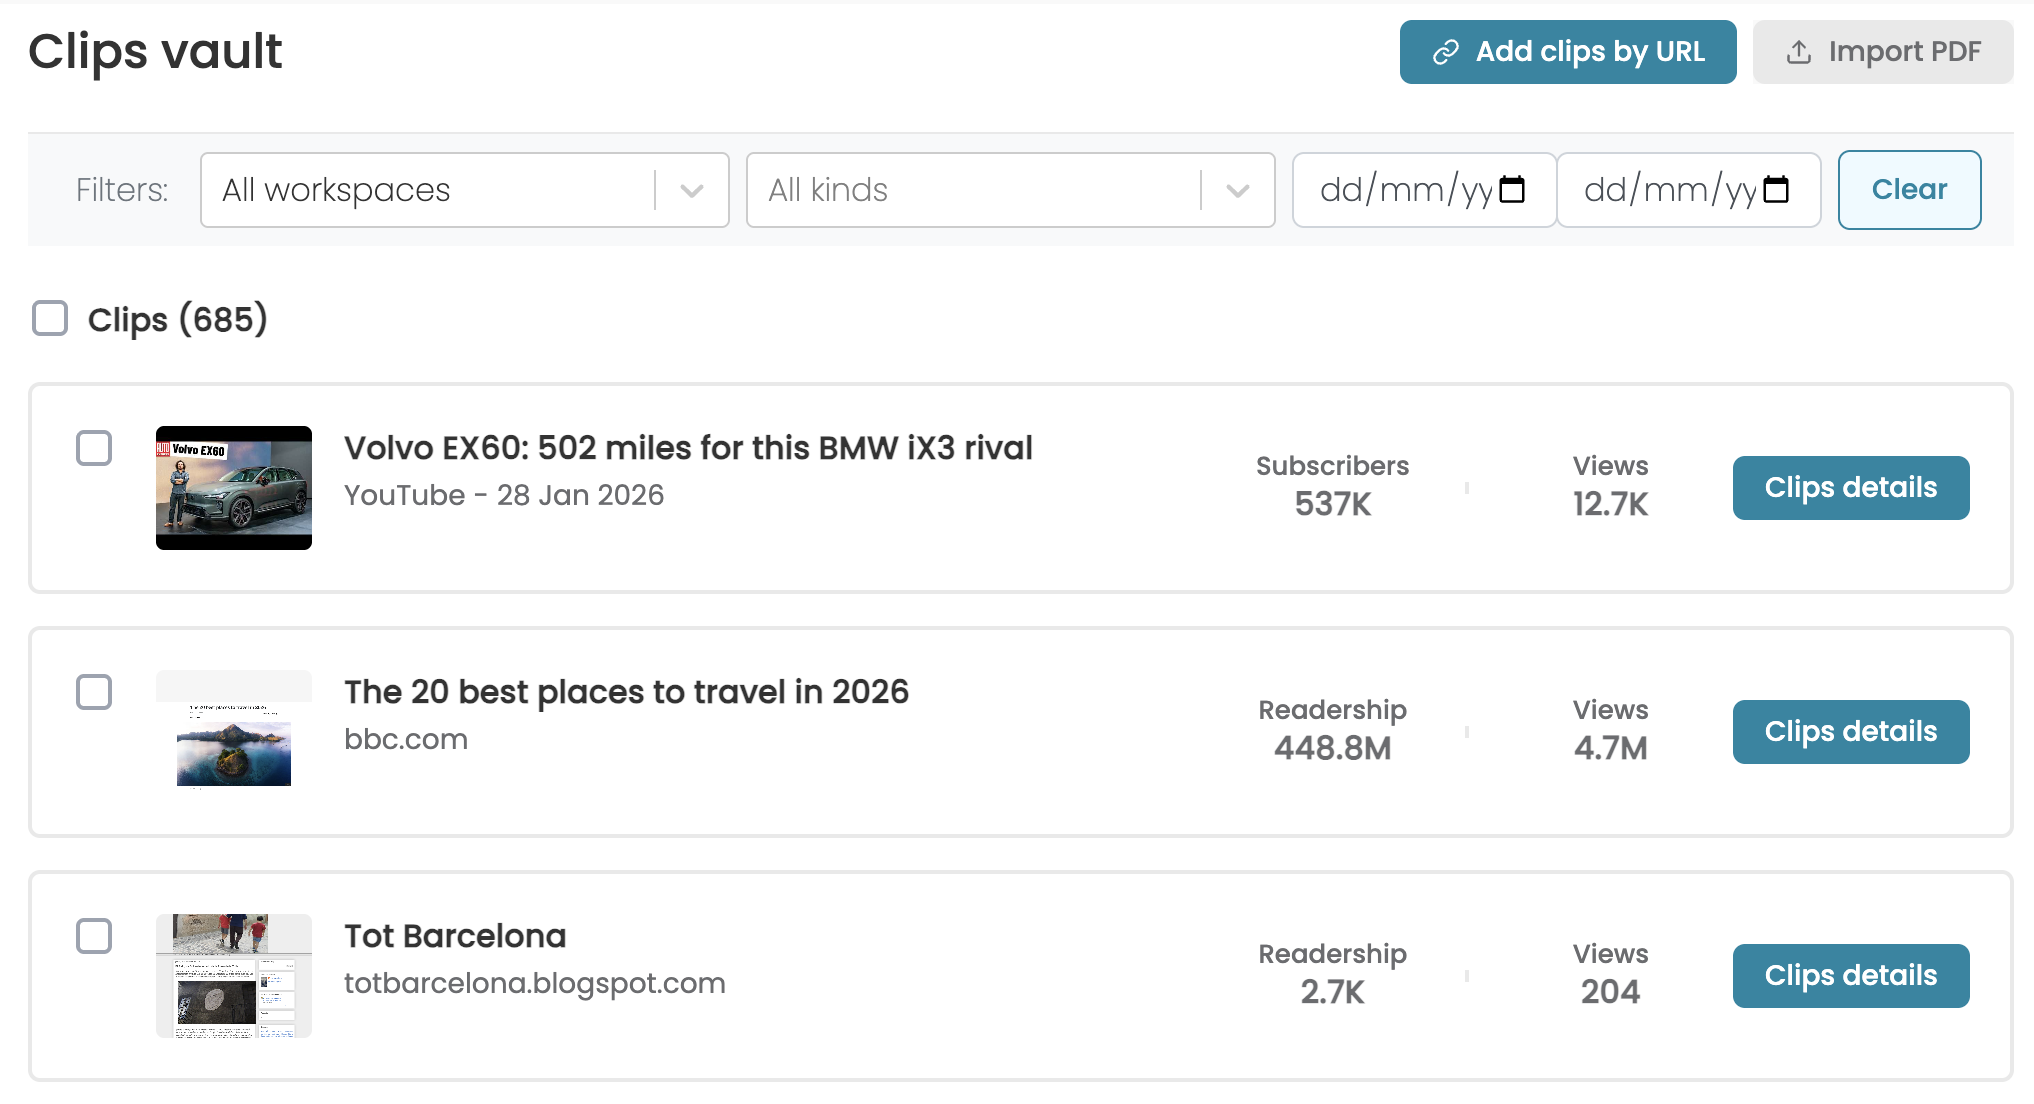
- Stores everything in a searchable media archive with date and platform filtering.
- Handles all media types: online articles, Instagram, LinkedIn, X, TikTok, Facebook, YouTube, and print PDFs.
When it is time to report, select the clips you want, choose a layout, and generate a professional report in minutes. Share as an interactive link, export as PDF, or download the raw data as CSV.
All plans include unlimited reports, clients, and team members. You only pay based on clip volume.
Discover how easy PR Reporting can be with all data in one place.
You earned the results. We'll help you show them off. Experience automatic clipping, professional design, and smart automation.